Introduction
Tutorials
Improving a discharge simulation
This tutorial describes how to improve a discharge simulation by allowing for secondary feedzones and formation temperatures. You will:
Create a new well FZWELL.
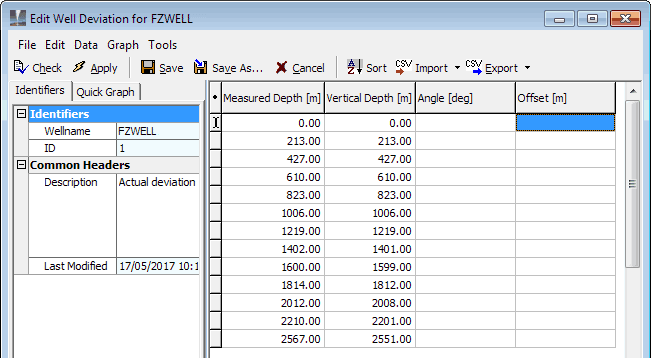
Create a new well deviation using this data:
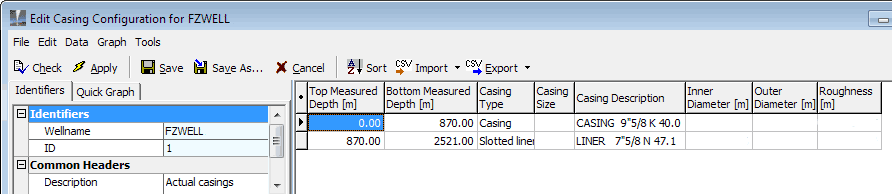
Create a new casing configuration using this data:
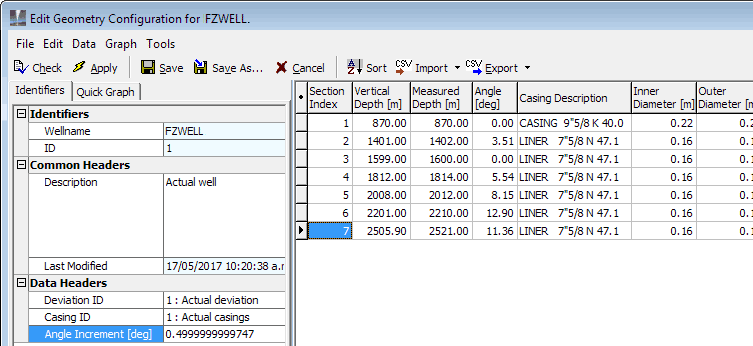
Create a new well geometry using this data. Note that you only need to enter the data on the left of the window; when you click Apply WellSim will calculate the data on the right:
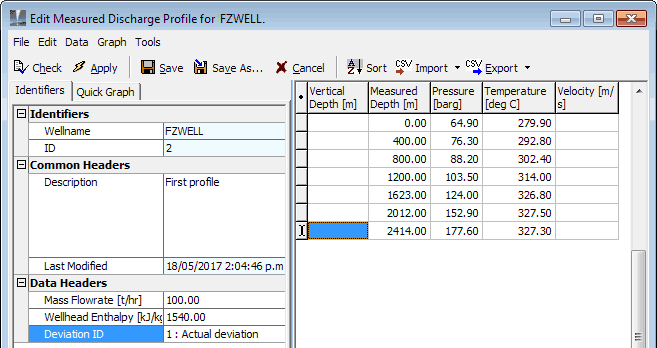
Create a new measured discharge profile using this data:
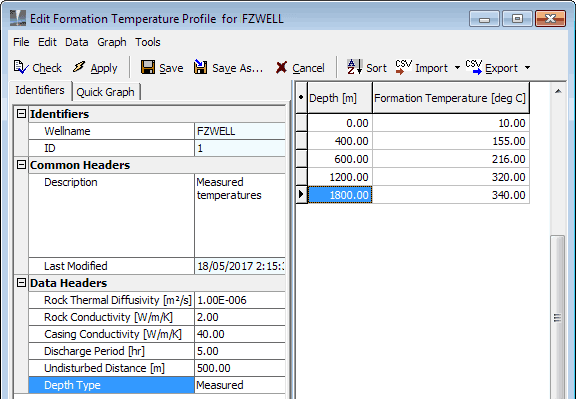
Create a new formation temperature profile using this data:
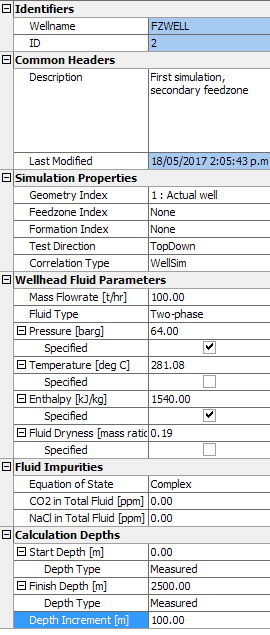
Create a new discharge simulation using this data (don't enter a secondary feedzone or formation temperature profile yet):
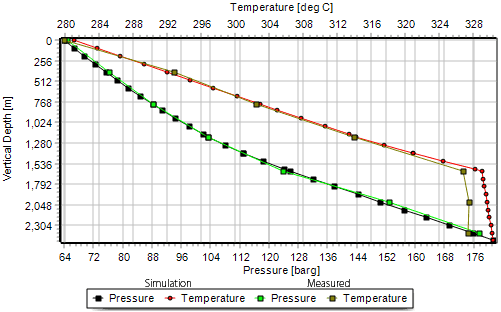
Run the simulation. In Measured profile select the measured profile that you created above (First profile). Tick Visible:
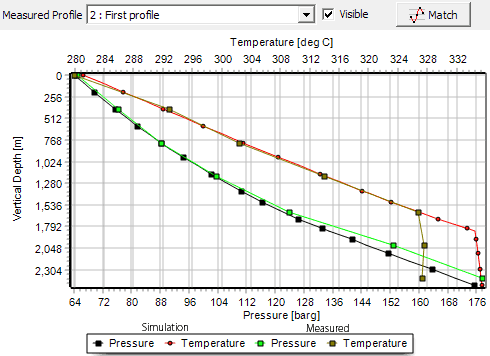
The simulation doesn't match the measured profile very well because the simulation doesn't have a secondary feedzone or formation temperatures yet.
Now:
Assume we have a spinner run showing a secondary feedzone of 15 t/hr at 1200 m measured depth. To be of use here, the spinner run must have been made at the same well flow as when the wellhead measurements for the discharge simulation were made.
We estimate, from other measurements, that the enthalpy of the secondary feed is 1750 kJ/kg.
We estimate that the secondary feed is not steam.
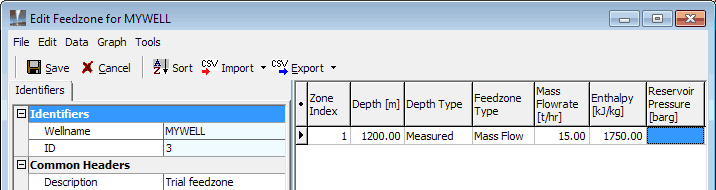
Create a new mass flow secondary feedzone using this data:
Now, we will change the secondary feedzone enthalpy until the discharge simulation and measured profiles match:
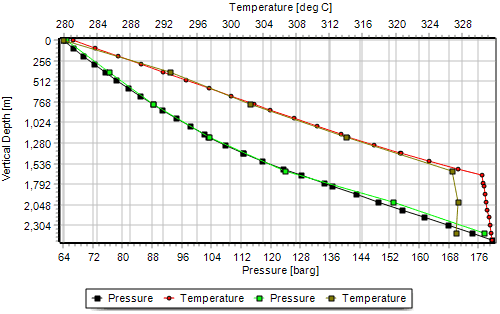
Edit the discharge simulation that you created above: In Feedzone index, select the secondary feedzone that you created above (Trial feedzone). Run the simulation. If necessary, display the measured profile that you created above (First profile):
The match between the simulation and the measured profile is better but not great. Lets try changing the secondary feedzone enthalpy for a better match.
Click Edit secondary feeds to display the secondary feedzones. Change the feedzone enthalpy to 1700 kJ/kg and click Run on the simulation. The match is worse:
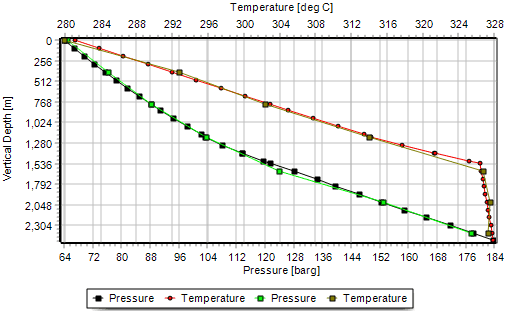
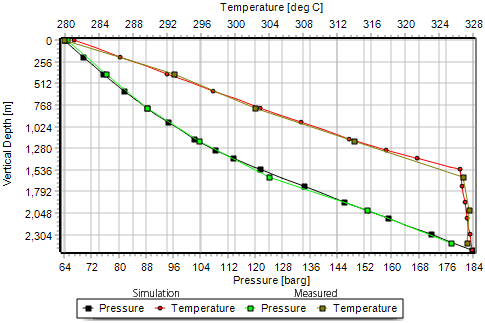
Increase the feedzone enthalpy to 1800 kJ/kg and try again. The match is better. Try again. An enthalpy of 1840 kJ/kg seems best:
We have now modelled the secondary feedzone, but it of type mass flow and is therefore only valid for one set of well conditions. We will convert it to a linear secondary feedzone, which WellSim can use for other well conditions. Note that we have to assume a linear drawdown factor now because we don't have enough data to work with a quadratic secondary feedzone:
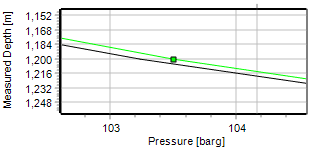
First we need to find the pressure in the well at the depth of the secondary feedzone: 1200 m (measured): zoom in on the pressure series; at this depth the well pressure is 103.3 barg (use the black series, the simulation):
Now we estimate, from other measurements, that the reservoir pressure of the secondary feedzone is 110 barg.
The linear drawdown factor is the pressure difference across feedzone divided by the mass flowrate of the feedzone read more about feedzones:
Linear drawdown factor = (110 barg - 103.3 barg) / 15 t/hr = 0.45 barg / (t/hr)
In the above discharge simulation, change the secondary feedzone data to:
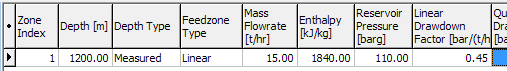
Run the simulation. The result is much the same, as expected.
You can now use this secondary feedzone profile with discharge simulations for other well conditions.
If your spinner run shows more than one secondary feed, you can model these in a similar way. As linear feeds initially.
If you discharge the well at other conditions then you repeat this process to recalculate the linear drawdown factor:
Edit the discharge simulation that you created above: In Formation index, select the formation temperature profile that you created above (Measured temperatures). Run the simulation.
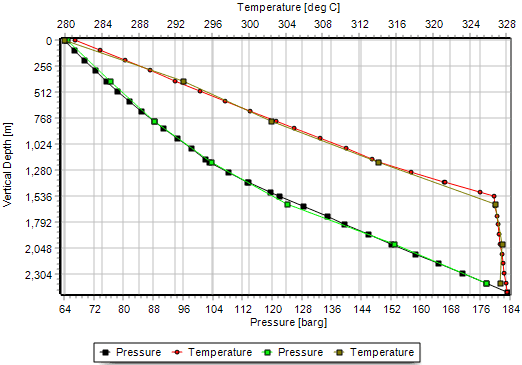
The difference is only slight. WellSim usually works fine without formation temperatures.
Try changing other discharge simulation parameters, to get a closer match between the simulation and the measured profile. For example, look at the lower bounds analysis at the discharge simulation's flow rate and see what it suggests for the CO2 concentration.