

The following images are screenshots from GeoData Manager. Click an image for a larger view.
-
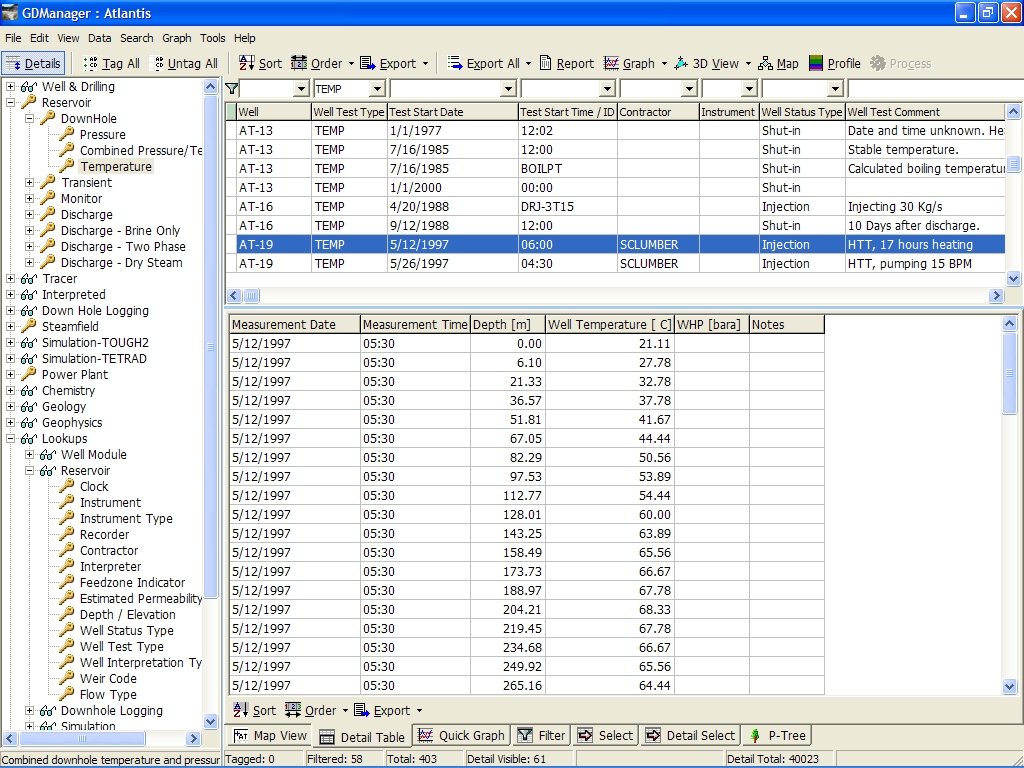
- Detail table display for each highlighted data set.
-
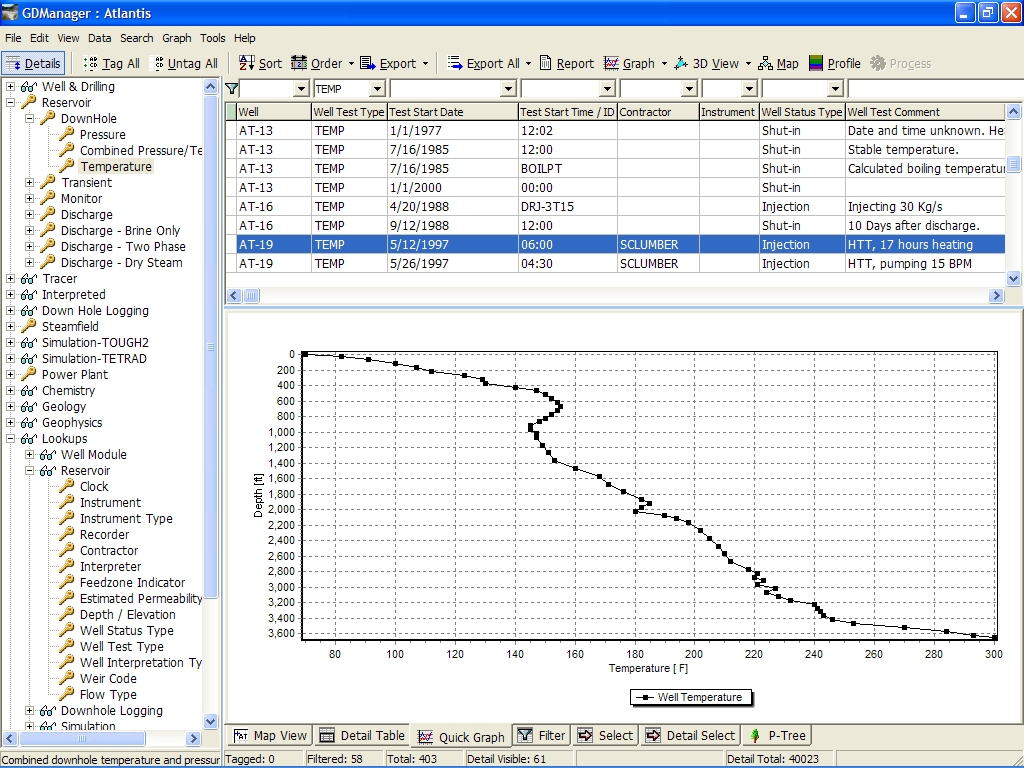
- Quick graph of downhole pressure/temperature
-
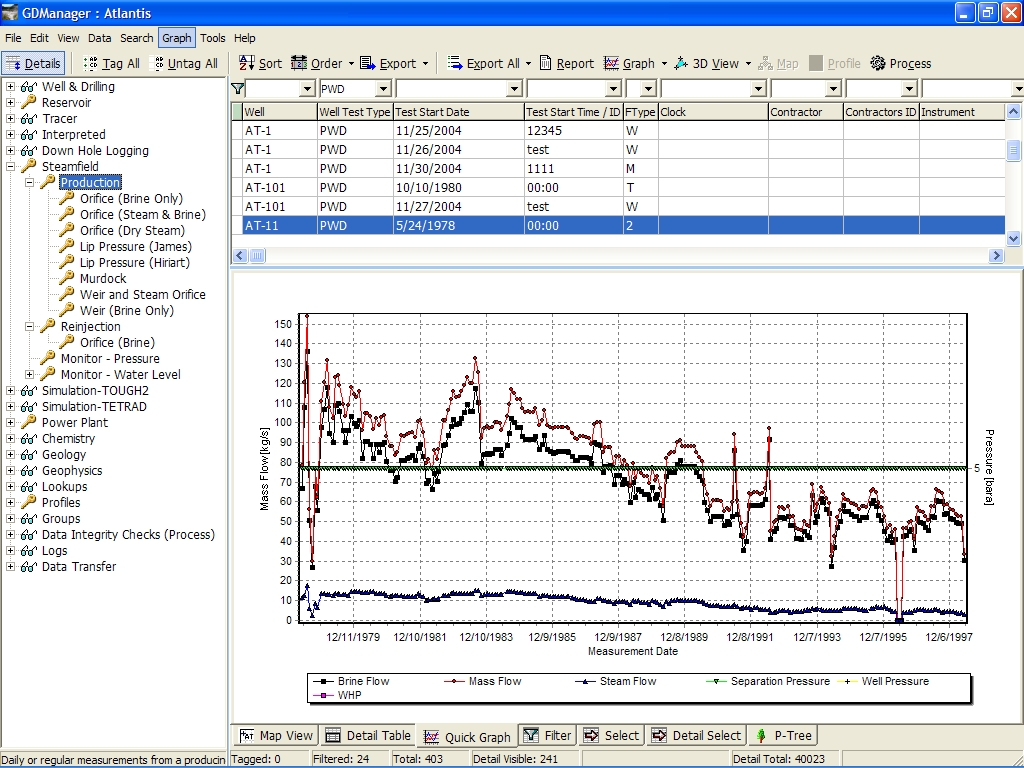
- Quick graph of production data
-
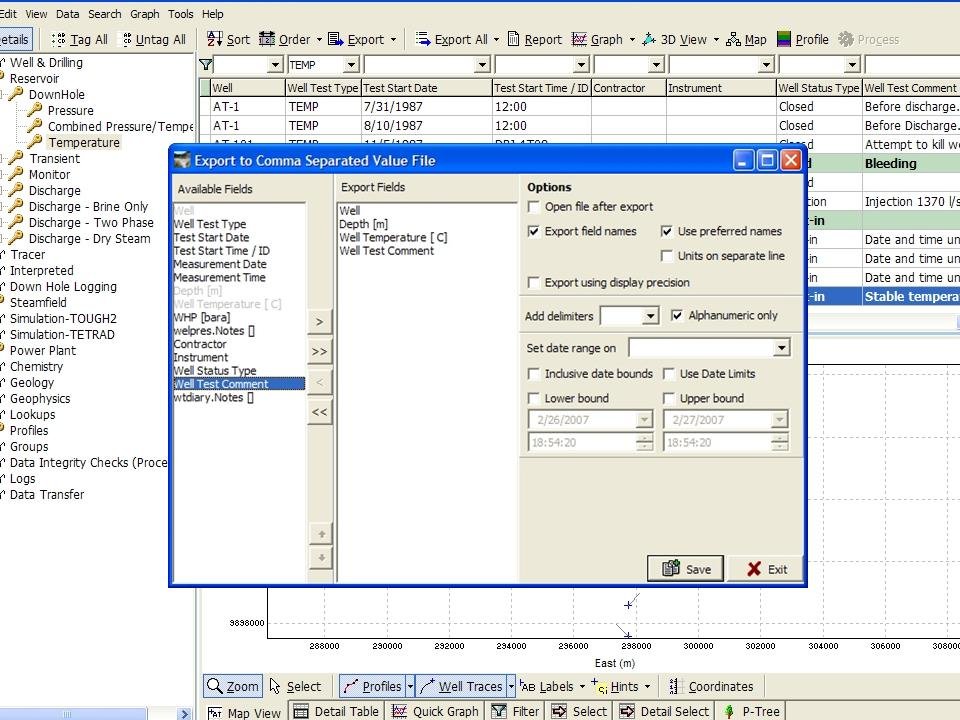
- Export of data to a csv file
-
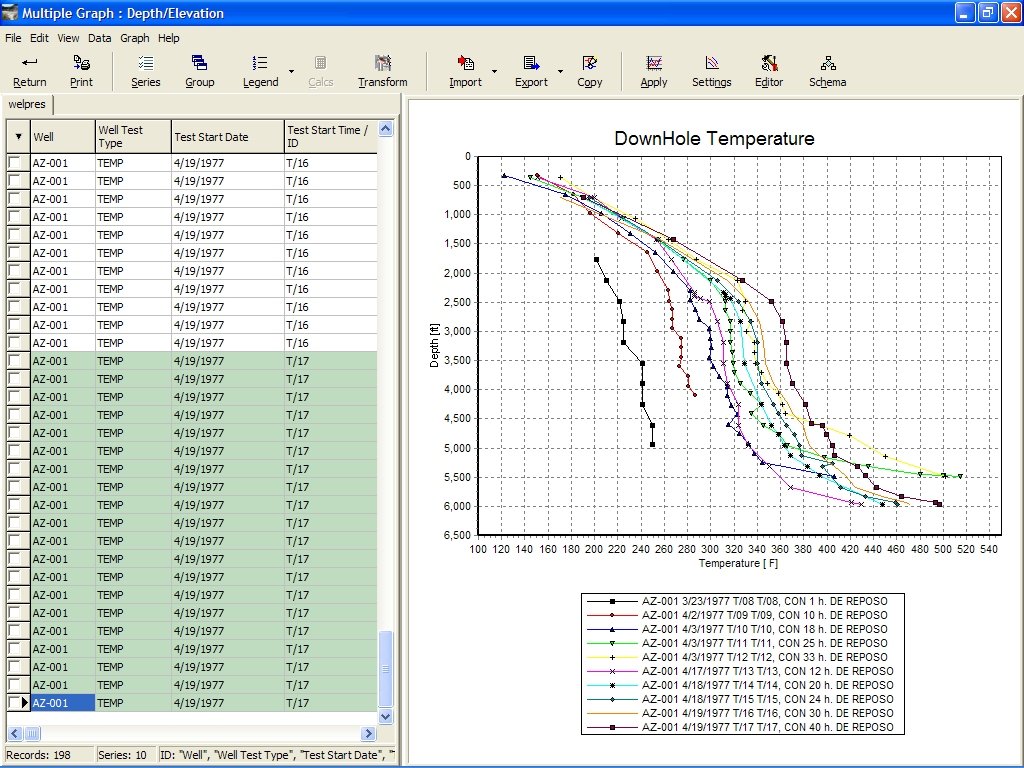
- Temperature curves showing well heating
-
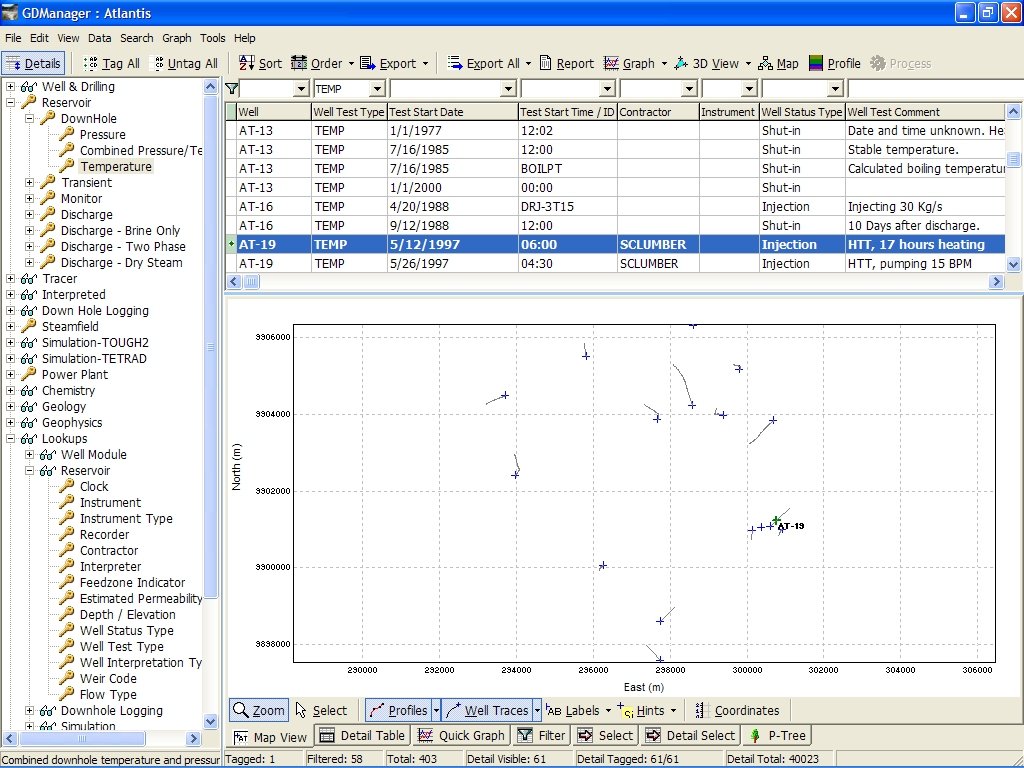
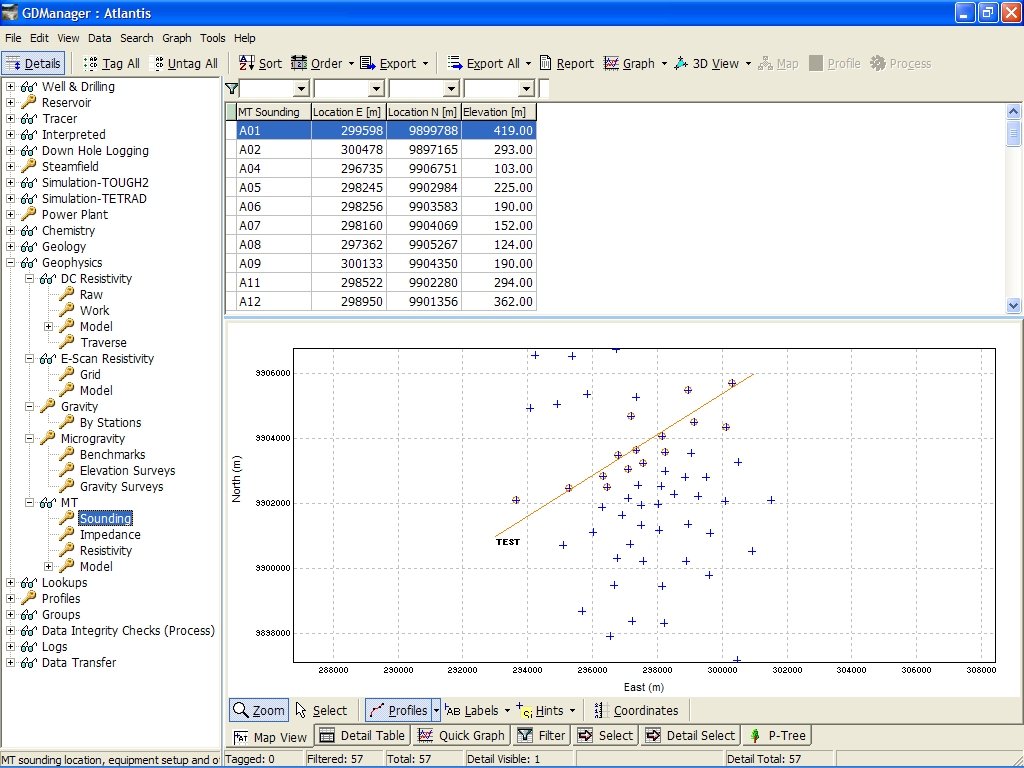
- Using Map View to show location of selected data
-
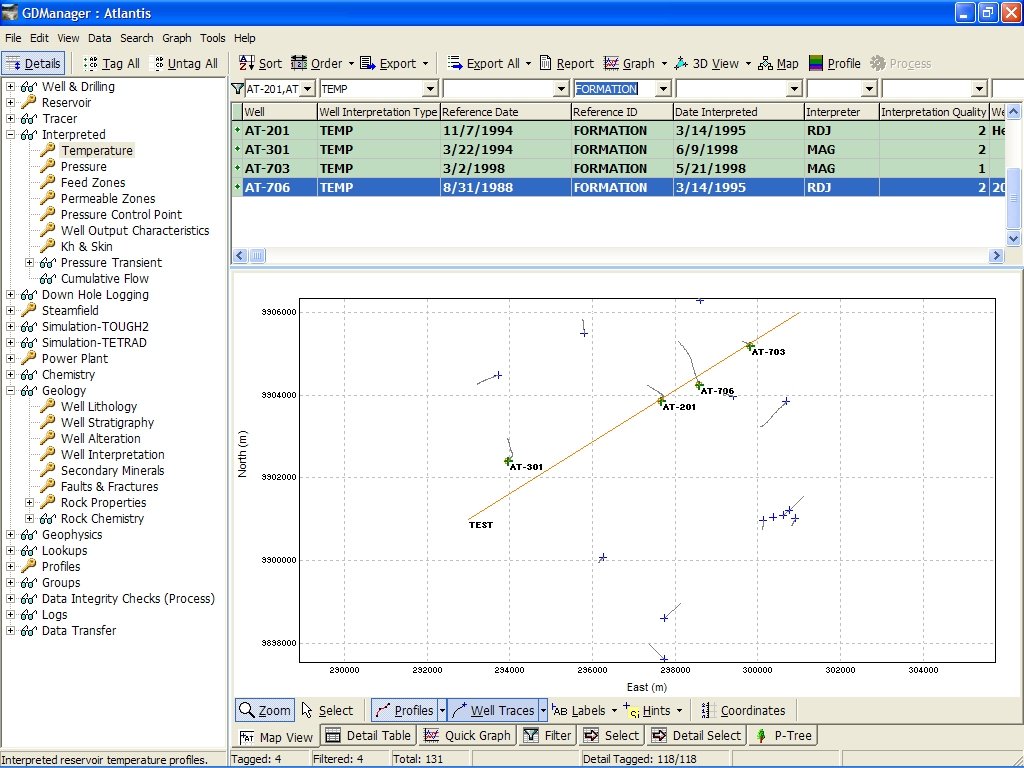
- Using Map View to create a cross-section
-
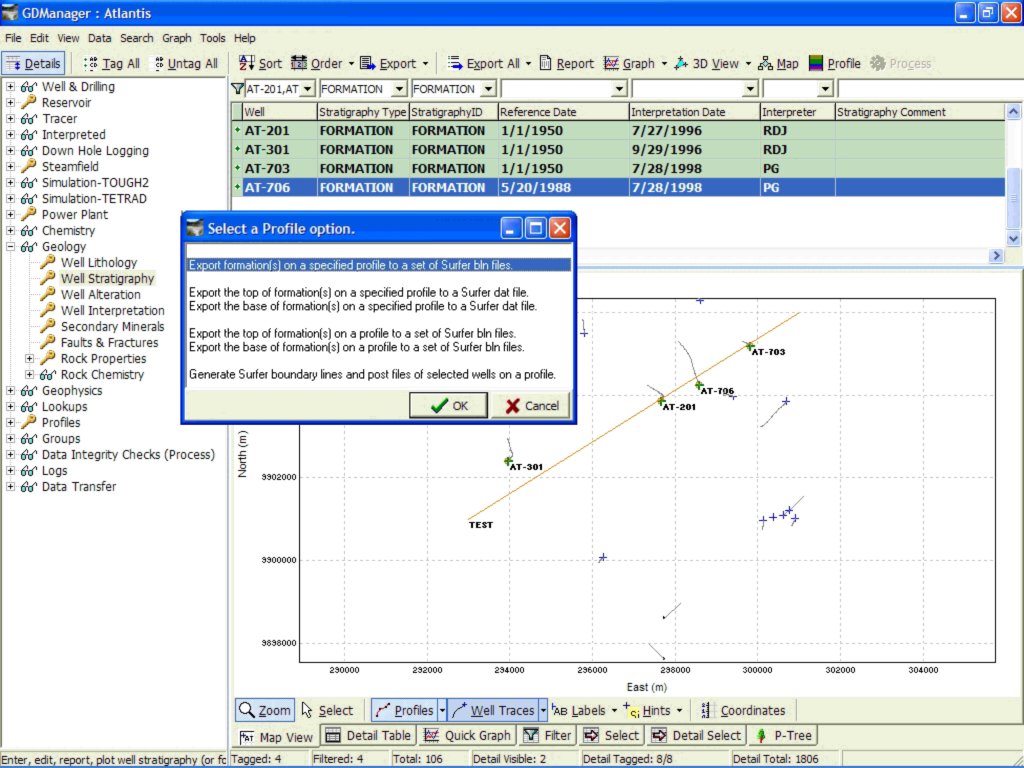
- Geology module showing cross-section options
-
- Magnetotelluric cross-section in Map View