Introduction
Tutorials
Getting familiar with GeoData Manager
Changing how GeoData Manager looks
Scenarios for using GeoData Manager
Data types and nodes
Help with data types and nodes
Getting familiar with GeoData Manager
Changing how GeoData Manager looks
Scenarios for using GeoData Manager
Help with data types and nodes
This tutorial introduces you to:
You can use GeoData Manager in many ways, but you will usually cycle around these steps:
Enter and edit data, for example wells, downhole tests, discharge tests, chemical sites, chemical analyses.
Output the data; GeoData Manager has many ways to output data and some typical scenarios are described here.
As you use GeoData Manager, adjust it to suit your needs:
To learn how to use GeoData Manager:
Work through the tutorials in this help guide.
See here for a list of GeoData Manager's commands.
GeoData Manager comes with a built-in database, called the sample database, which we will use in these tutorials. Read more about databases.
Run GeoData Manager and double click the sample database. GeoData Manager opens its home window.
If you have changed to a different database, then for these tutorials, open the sample database like this:
Click Database (in the menu bar), then click Database Manager.
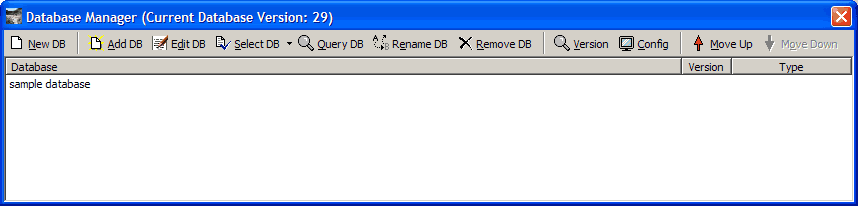
Click sample database, then click  . Or double-click
 sample database.
The database stores individual items of data, for example:
These items are called fields read more about fields. All fields in GeoData Manager have a location (called a site) and a unit (see below).
The available units include SI (m, kg, Pa/m ...), other standard sets (Metric, Imperial), unusual or customary units (fathom, degrees R, leos ...) as well as purely software units (numeric, alphanumeric, none ...). Read more.
Unit names in the program are enclosed in square brackets, for example [deg C].
Each field has a unit, either displayed beside the field or at the top of a column of fields.
If you change the unit for a field, then the number you see will change accordingly. However, all data is stored in SI units, therefore the number stored in the database will not change, and the results of any calculations will not change.
For example, if a wellhead temperature of 300.0 [deg C] is displayed and you change the units to degrees F then it will change to 572.0 [deg F].
GeoData Manager has four default unit sets: SI, Company, Imperial and Metric.
For the tutorials in this help guide, load the Metric unit set:
Click Settings (in the menu bar), then click Unit settings.
If necessary, vlick the UnitTypes tab.
Click the Sets drop-down list (at the foot of the tab) and click the Metric unit set:
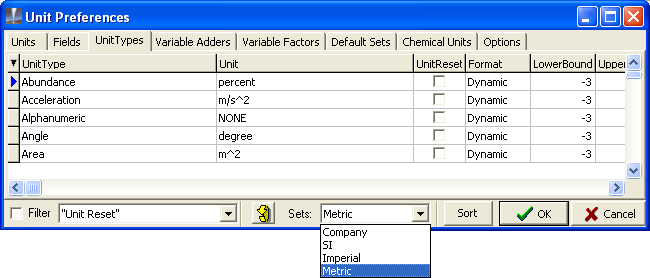 .
.
Click OK.
You can change units on the fly. Only do this to make short-term changes to unit names, not long-term changes.
After you have finished these tutorials and want to enter real data for your wells, you can make long-term changes to the unit names by choosing one of the scenarios for using units.
When GeoData Manager starts, it displays the home window. From the home window, you can select commands to work with your data. The labels show the main parts of the home window:
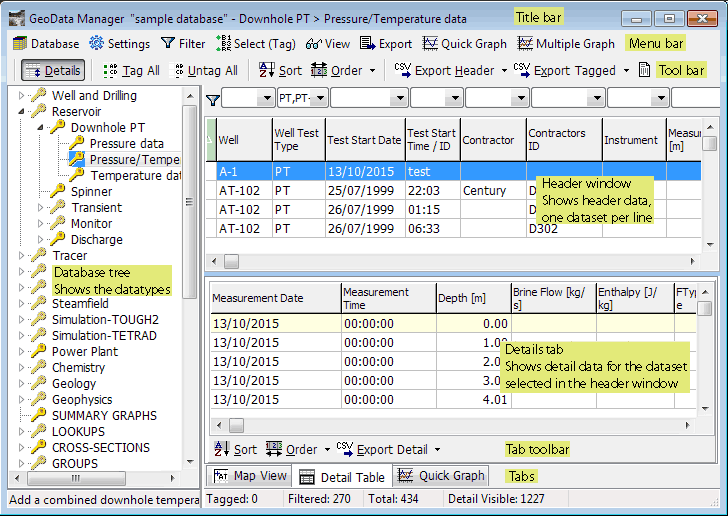
Your window will have the same parts as the picture above, but it will look different:
Depending on what data you have choosen to display.
Because I have chosen a low-resolution image to fit this help guide.
The title bar at the top of the window shows:


Click a name in the menu bar to see a list of commands available, then click an item in a list to start the command. A greyed-out command shows that the command is unavailable for the data in the home window. Read about the menu commands.

Commonly-used commands. Click a command in the tool bar to start it. A greyed-out command shows that the command is unavailable for the data in the home window. Read about the toolbar commands.
Now follow these links to find out what these terms mean:
The database tree is a list of the built-in datatypes available. Each item in the list is more commonly called a node. There are so many datatypes or nodes that they are arranged by category, and this list is said to be in the form of a tree.
You can collapse or expand the tree to show different data types or categories of data types:
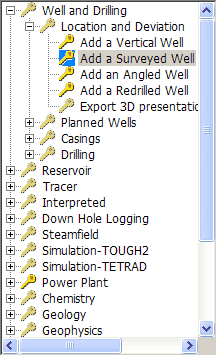
Click File (in the menu bar), then click Collapse All Tree Nodes. This displays the main categories of data types. You can tell categories because they have a + in front.
In the database tree, click the + in front of Well and Drilling. This displays the sub-categories within Well and Drilling.
Click the + in front of Location and Deviation. This displays the data types within Location and Deviation. You can tell data types because they do not have a + in front. Add a Surveyed Well is one of the types.
Note:
The status bar also shows your current category.
When you exit GeoData Manager, it remembers the database tree layout.
There is a symbol just to the left of each node; in the list above it is a key. If the symbol is grey then you can not enter or change data at that node (though you might be able to at a subnode). The symbol you see is determined by the database permissions you have been assigned read more.
And:
For more on working with the database tree see here.
For more on navigating through the database tree see here.
For help figuring out which node to select to see some particular data see here.
A node is a line on the database tree, and is therefore a datatype or a datatype category read more.
Now:
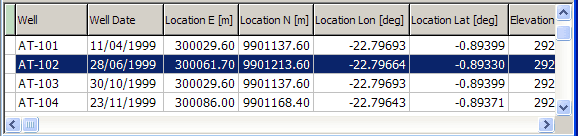
In the database tree, click Add a Surveyed Well in Location and deviation. This displays the surveyed wells stored in the database.
To the right, click the well AT-102. This selects AT-102.
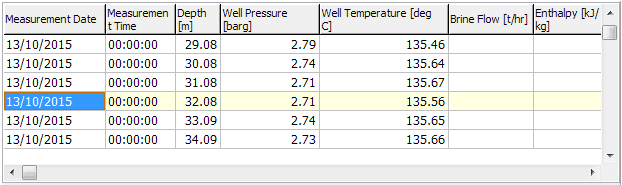
At the bottom, click the tab Detail Table. This shows detail data for AT-102.
A database usually has many data sets of each data type; the filter bar helps you select data sets to work with read more.

Now follow these links to find out what header data and detail data are.
The header window shows header data for the datasets of the datatype you selected in the database tree. This header window shows surveyed wells:
There is usually more data than will fit in the window. Use the horizontal scrollbar to see the rest of the data.
There are usually more dataset headers than will fit in the window. Use the vertical scrollbar to see the others.
The tabs display details for the dataset selected in the header window. Click the tab toolbar buttons to see different data:

If you can't see the tabs, click  in the top roolbar.
Click in the top roolbar to hide or show the details tab.
Use the scroll bars to see all the data.
And:
Click Map View to see a map of where the data sets are located in the geothermal field.
Click Detail Table to display the detail data for the dataset selected in the header window.
Click Quick Graph to see a graph of the detail data for the dataset selected in the header window.
For example, this is the detail table for surveyed well AT-102:
See here for more information on tabs.
You can undock tabs from the main window to be independent windows see how.
Each tab has a tool bar of common commands. This is the Detail Table tab's toolbar:

See here for more information on the tab toolbar commands.
Shows information about what is displayed above.

To exit GeoData Manager:
Click Return or Cancel to return to the GeoData Manager main window. Then:
Either click File, then click Close
or click the X at the top, right of the GeoData Manager window.
Then click Yes. If more than one GeoData Manager window is running, you are asked if you want to close that window or all windows read more.